So, as I’ve pointed out a few times, our “social distancing” efforts are working. And they’re pretty much the only thing that will work in this situation.
But it’s likely that we’re reaching the limit of how much they’ll work.
I’ve mentioned the Kinsa thermometers, and the map of fevers they’ve been publishing, before (starting with Kinsa Thermometers: Maybe A Good Thing Right Now?).
Here’s their current status for my county:
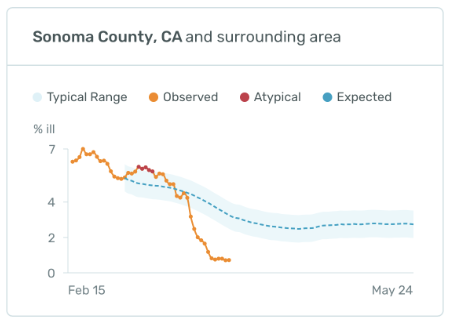
The level it’s stabilized at there is around .75% of their users in the county having a fever.
Which is pretty good, compared to their expected level.
But it stopped getting lower on May 27th.
The stay-at-home “order” for this county was issued on the 16th, so that’s 11 days in (and more like 17 days after a bunch of the tech community sent everyone they could to work from home).
So, to the extent that this data is actually good (and we have no real way of evaluating that, since it’s proprietary corporate data), it’s been levelled off for about as long as the incubation period of this virus; maybe a few days short of the maximum, but well after the minimum.
So, the new cases we’re seeing now-ish will be folks who were infected after the social distancing started.
And how’s that going?
Well, the new-cases-per-day have in that time been between 4 and 11, with an average of 7.3 and no upward trend:
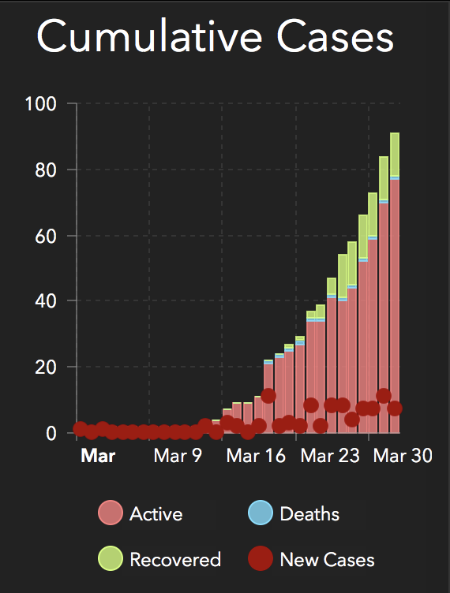
The total cases is still growing steeply, but with the new cases being flat that steepness is mostly due to the small number of total cases.
So that’s good.
Quite good, actually.
This tells us that we can slow this down, at least in places like this county where the absolute numbers are still relatively low, and likely that we will be able to keep this in the levels where our hospitals can manage without having to get more extreme about it.
If we keep doing it, and doing it well.
And if we can keep our healthcare workers well enough protected that we don’t dramatically decrease our healthcare staffing.
(And we should be doing that anyway, if only out of basic human decency.)
But …
It’s important to remember that all this is doing is spreading out the infections over time, to keep the resource load manageable. The virus is still in our community, and still spreading; it’s just spreading very slowly, and will speed right up if we relax about it.
This tells us nothing about when this growth will peak, or when we can expect this to be over.
We won’t know anything about a likely peak until somewhere emerges from the other side, which will give us some data on transmissability limits so we can build better models. There are epidemiologists trying to predict a peak using models based on other viruses and what we actually know about this one, but their results come with so much uncertainty that I’m not convinced they’re really useful yet.
And it won’t be over until we have good evidence that recovering from the infection confers a strong immunity to re-infection, which does not look likely so far, or we develop and distribute an effective vaccine. And, as I said most recently in Social Distancing: It’s Not Just Hunkering Down Anymore, a vaccine is probably 2 years or so down the road.
So, settle in.
It’s gonna be like this for a while, but at least it’s working.
- Subvert.fm: A Consumer Cooperative For Music Downloads - 2026-07-16
- You Should Read This: Hating AI in 2026 - 2026-07-15
- Administrivia: User Account Cleanup - 2026-07-10
Just to be clear: all the numbers and interpretation here is local to Sonoma County, California. You, wherever you are, will likely be at a slightly different place on the curve (or on a totally different curve altogether).
You’ll have to look up your own local data and do the same (relatively simple) math to see what your local situation is.
But at the very least my local numbers serve as a demonstration of the effectiveness and limits of this level of social distancing effort.